Welcome to our comprehensive guide aimed at Understanding Crime and Disorder in Calgary. With a data-driven approach, this guide aims to offer residents and newcomers an in-depth look into the state of safety in our city. Below, you will find key insights, interactive maps, and actionable tips for community engagement.
Key Insights on Crime and Disorder in Calgary: A 2022 Overview
In a bustling city of 1.4 million residents, how safe are the streets of Calgary? We’ve crunched the numbers to provide you with a snapshot of crime and disorder in 2022.

- Calgary’s Relative Safety: With a crime rate of just 2,300 per 100,000 residents, Calgary far outpaces the national average of 5,600 per 100,000, making it a relatively safe place to live.
- Incident Breakdown: Of the 122,000 incidents reported, only 23.68% were actual crimes. The majority were related to other forms of disorder, highlighting the city’s focus on community well-being.
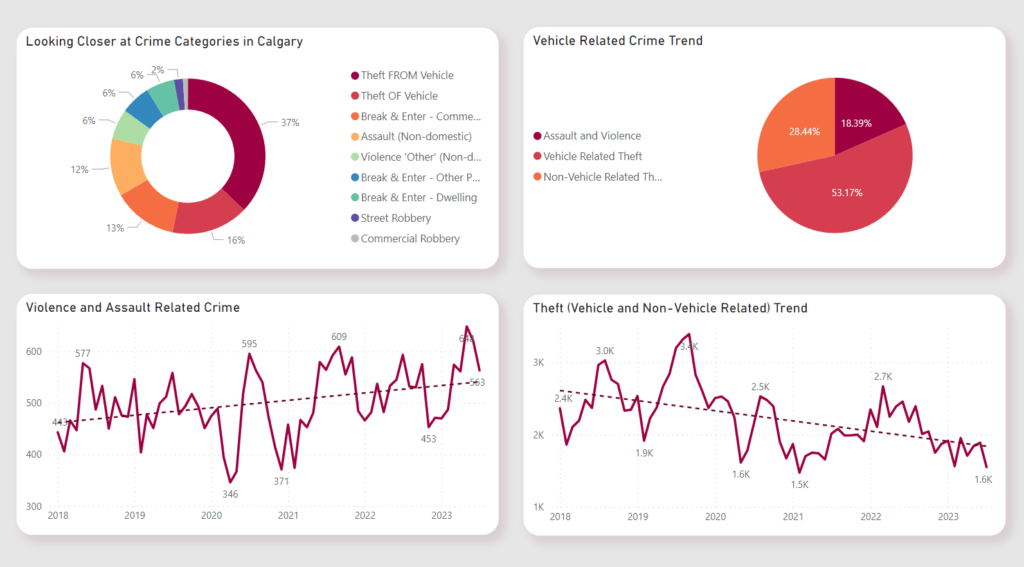
- The Vehicle Theft Epidemic: Vehicle-related thefts make up a startling 53% of total crimes, indicating a specific area that may need targeted interventions.
- Population vs Crime Growth: While the population grew by a modest 3%, crime incidents saw an 11.67% uptick, a discrepancy that warrants further investigation.
- Five-Year Trend: Despite the recent increase in crime incidents, the overall trend over the past five years has been declining, offering a glimmer of hope.
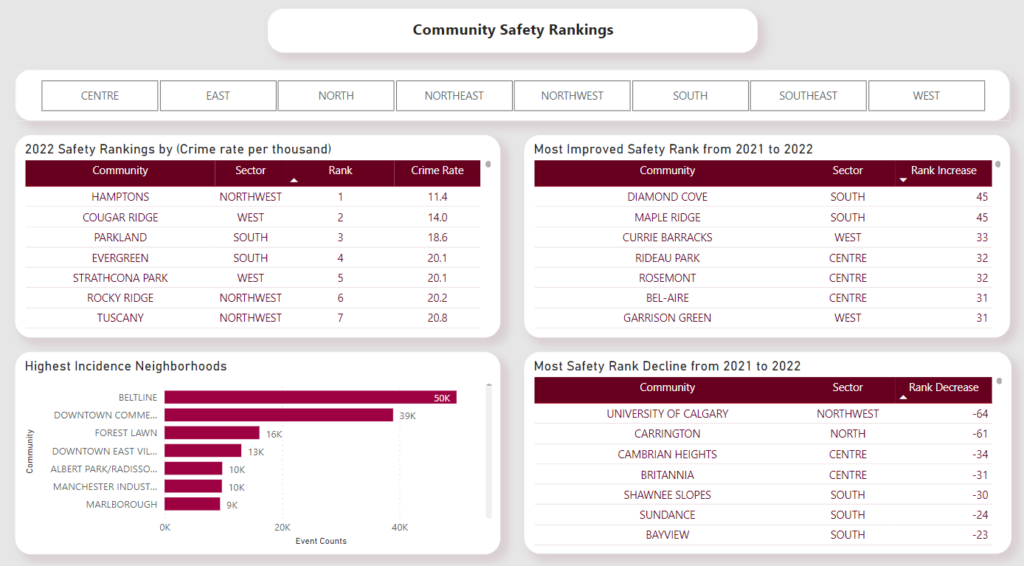
- Hotspots vs Safe Havens: While bustling neighborhoods like Beltline and Downtown Commercial are crime hotspots, communities such as Hamptons, Cougar Ridge, and Parkland stand out as the safest.
- Most Improved Communities: Diamond Cove and Maple Ridge have made significant strides, each improving their safety ranking by 45 spots.
- Communities to Watch: University of Calgary and Carrington have seen a significant drop in safety rankings, warranting immediate attention and further investigation.

A Closer Look at Crime Categories in Calgary

This section delves into the specific types of crimes that dominate Calgary’s safety landscape. It reveals that vehicle-related thefts make up a significant 53% of total major crimes, emphasizing the need for strong vehicle security measures. Non-vehicle related thefts, although less common, still account for 28% of crimes but are on a decline. Contrarily, violent crimes, including assault, are showing a troubling increase, calling for community vigilance and perhaps more focused policing. The section wraps up with key insights aimed at helping Calgarians stay informed and take proactive safety measures.
Community Safety in Calgary: Where to Live and Where to Avoid

When it comes to choosing a neighborhood in Calgary, safety is often a top consideration. Our guide “Community Safety in Calgary: Where to Live and Where to Avoid” offers a comprehensive, data-driven look to help you make the best choice.
In this guide, you’ll find that neighborhoods like Hamptons and Cougar Ridge rank as some of the safest, while Beltline and Downtown Commercial Core have higher rates of crime. But the landscape is ever-changing. Communities like Diamond Cove and Maple Ridge have shown remarkable improvements in safety. Conversely, areas like the University of Calgary and Carrington have seen their safety ranks decline, serving as a cautionary note for potential residents.
Whether you’re considering a move to Calgary or are a current resident looking to gauge your community’s safety, our guide provides the insights you need to make informed decisions.
Conclusion and Next Steps
Calgary is more than just its crime statistics. It’s a city filled with communities striving for safety and well-being. While challenges persist, the downward trend in overall incidents and the improvements in specific communities offer hope.
Dive deeper into each section by exploring our detailed Power BI reports. Stay informed, stay engaged, and let’s make Calgary safer, together.
Methodology
Data Sources
The analysis presented in this guide relies on multiple trusted sources for data collection:
- Calgary Police Statistical Reports – Provides the bulk of crime and disorder statistics.
- Community Disorder Statistics on Data.Calgary.Ca – Used for resident count data, essential for per-capita calculations.
- Community Crime Statistics on Data.Calgary.Ca – Augments the data from Calgary Police Statistical Reports.
- Statistics Canada – Provides the national crime rate for benchmarking Calgary’s crime rate.
- Population by Municipality on Open Alberta – Used for additional population data to cross-verify resident counts.
Data Cleaning and Transformation
Data sets were thoroughly cleaned and transformed to ensure accuracy. The primary transformations included:
- Data Merging: Combined data from CPS and data.calgary.ca to create a comprehensive dataset.
- Resident Count: Opted to use the resident count from data.calgary.ca for more accurate per-capita crime rates.
- Crime Categories: Aggregated specific types of crimes into broader categories for better understanding.
- Time Periods: Focused on data from 2018-2022, with particular emphasis on the year 2022.
- Community Analysis: Created new calculated columns and DAX measures in Power BI to analyze community safety rankings.
Data Analysis Tools
The analysis was primarily conducted using Power BI for visualization and Python for advanced data transformations and analytics. The data was stored in an Azure SQL Server, providing a robust and scalable environment for data manipulation.
By adhering to this methodology, we aim to provide a balanced and comprehensive view of crime and disorder in Calgary, backed by credible data and robust analytics.
Feel free to explore our detailed Power BI reports for a deeper dive into each section.
